The views expressed in this blog are my own personal market observations and reflections. They do not constitute investment advice, a financial promotion, or a recommendation to buy or sell any security. This publication is not made in my capacity as a director of Quay Financials (Gibraltar) Limited. Read the full disclaimer.
Dear Quay Financials,
Palm Sunday on the Rock and the light over the Bay has that washed-clean quality you only really get in early spring. Ferries still trace their routes, bunkering barges still nose around the anchorage, and from a distance the Strait below looks almost surgically calm. The usual illusion: a busy chokepoint pretending to be a pond.
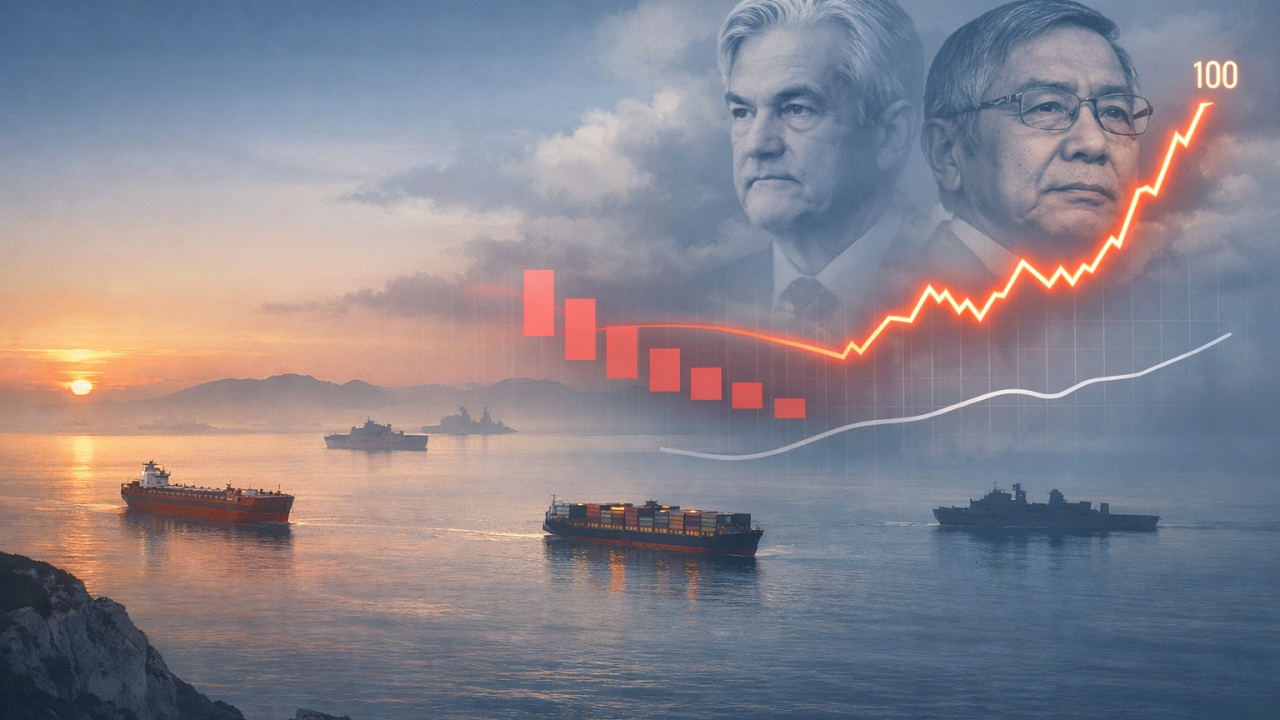
A few thousand miles east, the other chokepoint remains anything but calm. Hormuz is still half-closed, oil has settled into a new, uncomfortable range just shy of three digits, and markets have now racked up five consecutive down weeks as the war premium bleeds from futures screens into inflation expectations, yield curves, and risk budgets.
So, espresso in hand and church bells in the background, let’s walk through a week where three narratives did the heavy lifting: a war that refuses to de-escalate, a market that has stopped expecting rate-cut rescue, and a Japanese bond market that is no longer anyone’s punchline.
Recap: Where Week 12 Left Us
Last week ended with Hormuz upgraded from “headline risk” to working energy tax: WTI around 98 dollars, Brent back through the triple-digit line, and traders treating Iran’s mix of drones, mines, and missiles as an operating regime rather than a bluff.
The Fed delivered its March “hold” at 3.50–3.75 percent, nudged its inflation forecasts higher, and let Powell codify what markets had already suspected: 2026 would be a year of “later and shallower” cuts, not the great easing cycle once hoped for. In Tokyo, Ueda kept the BoJ’s overnight rate anchored around 0.75 percent while gesturing toward a very slow exit from ultra-easy policy – enough to keep term premia creeping higher, not enough to scare the Nikkei out of its year-to-date leadership.
We came into Week 13 with three open questions: whether Trump’s 48-hour ultimatum would produce real movement in Hormuz; whether markets would keep fading the Fed’s dots or finally take Powell at his word; and whether the quiet repricing of Japanese yields would stay a local story or start to matter for global duration.
If you missed last week’s dispatch you can find it here:
This Week: Week 13, 2026: War Premiums, Five Week Drawdowns, and JGBs on the Edge
Weekly Market Table
| Asset | Week 13 2026 close | Week 12 2026 close | WoW | YTD | Comment |
|---|---|---|---|---|---|
| S&P 500 | 6,369 | 6,506 | -2.11% | -8.10% | Fifth down week on the trot: war premium in oil and ‘no early cuts’ in rates finally drag the index 8–9% off January’s high. |
| Nasdaq Composite | 20,948 | 21,648 | -3.23% | -11.21% | Duration hurts: mega cap tech leads the drawdown as higher real yields and no Fed cavalry squeeze long dated growth narratives. |
| Russell 2000 | 2,450 | 2,438 | 0.48% | -3.34% | Small caps quietly outperform on the week – still fragile, but domestic cyclicals and energy help cushion the war and rates blow. |
| FTSE 100 | 9,967 | 9,918 | 0.49% | 0.98% | London clings to the high ground: deep value, banks and energy make the FTSE feel more like a cash flow vehicle than a growth index. |
| STOXX Europe 600 | 575 | 573 | 0.40% | -2.26% | Continental Europe muddles through: stagflation risk is real, but a better starting yield and sector mix keep the sell off orderly. |
| Nikkei 225 | 53,373 | 53,373 | 0.00% | 5.26% | Tokyo treads water as JGB yields grind higher – Japan is still the equity outperformer of 2026, but the easy liquidity phase is over. |
| Hang Seng Index | 24,952 | 25,277 | -1.29% | -3.36% | Hong Kong zigged while Wall Street zagged: policy support and China’s value bias let the Hang Seng rise 0.4% against a global risk off tape. |
| Gold ($/oz) | 4,494 | 4,497 | -0.07% | -0.78% | Bullion is trying to remember it’s a hedge: gold stabilises in the high 4,400s as yields and the dollar edge up alongside oil. |
| Bitcoin (BTCUSD) | 66,350 | 70,497 | -5.88% | -23.67% | Crypto trades like high beta tech equity: Bitcoin gives back part of last week’s pop as risk off sentiment and higher real yields bite. |
| WTI Crude ($/bbl.) | 99.64 | 98.30 | 1.36% | 70.76% | Oil now is the hedge: WTI holds just shy of triple digits as markets price a durable Hormuz bottleneck, not a one day scare. |
| US 10Y Treasury | 4.44% | 4.39% | 1.14% | 7.51% | Long bonds live in two worlds: war driven inflation risk keeps the 10 year pinned in the mid 4s even as five weeks of falling equities create a bid for safety. |
| US 2Y Treasury | 3.93% | 3.90% | 0.77% | 12.93% | The front end shifted toward a “later and shallower” easing path, with some desks openly sketching “no cuts” scenarios for 2026. |
| JPY 30Y Treasury | 3.71% | 3.53% | 5.10% | 8.80% | Japan’s ultra long yields continued their climb, with the 30 year near 3.5%, reinforcing the message that BoJ ‘normalisation’ is a slow grind but no longer theoretical. |
| US Dollar Index (DXY) | 100.2 | 99.6 | 0.55% | 2.31% | Classic wartime bid for the world’s reserve asset, reinforced by higher US yields. |
Week 13 and Week 12 closes, week-on-week movement and 2026 year-to-date performance, using the market table supplied with this edition.
US & Global Equities
US large caps finally priced the war premium. The S&P 500 fell about 2.1% on the week to roughly 6,368.85, marking a fifth consecutive weekly decline and leaving the index close to 9% below its January peak as investors digested a stickier oil-and-rates backdrop.
The Nasdaq Composite led the give-back. The index dropped about 3.2% to 20,948, with mega-cap tech and long-duration AI names doing most of the heavy lifting as higher real yields and the Fed’s “later and fewer cuts” message compressed growth-stock valuations.
The Russell 2000 managed a subtle relative win. Small caps ended the week up roughly 0.5% despite a 1.7% slide on Friday, helped by domestic cyclicals and energy-tilted names that can pass on at least part of the war-linked input-cost shock.
Europe absorbed the energy tax without panic. The FTSE 100 closed a touch higher around 9,967, and the STOXX Europe 600 edged up to about 575, as value-heavy, dividend-paying sectors cushioned the hit from stronger oil and a firmer dollar.
Japan’s Nikkei 225 paused for breath. The index effectively marked time around 53,373, more a digestion of earlier outperformance and rising domestic yields than a loss of faith in the earnings outlook.
The Hang Seng quietly outperformed Wall Street. Hong Kong equities inched about 0.4% higher to 24,951.88 as policy support and a value-tilted China complex kept the market looking less fragile than US growth benchmarks on down days.
Gold, Digital Assets & Commodities
Oil cemented its status as the hedge of choice. Front-month WTI settled near 99.64 dollars a barrel and Brent around 112.57, with traders now talking about a war-premium “regime” rather than a transient spike as Hormuz disruptions and wider Gulf risk persist.
Gold tried to remember it’s a hedge, not a rocket. Bullion oscillated in the high-4,400s per ounce, with Friday’s close near 4,493.79, as higher real yields and a stronger dollar offset some of the geopolitical bid that had driven January’s surge.
Industrial and energy exposure outshone pure ‘fear’ trades. Flows continued to favour oil-linked equities and cash-flow-rich commodity producers over levered gold or silver plays, extending the rotation that began in Weeks 11–12 when Hormuz shifted from scare to semi-blockade.
Bitcoin behaved more like beta than ballast. After closing last week near 70,500, the token slipped to roughly 66,350 by March 27, moving in step with high-volatility growth stocks rather than offering diversification when equities sold off.
Macro & Policy
The Fed’s March message kept doing the work. With policy on hold at 3.50–3.75% and projections nudged toward higher inflation and fewer cuts, markets spent Week 13 internalising that Powell’s “new inflation” from the Iran conflict means patience rather than pre-emptive easing.
The US curve stayed uncomfortably firm. The 10-year Treasury yield ended the week around 4.44%, while the 2-year hovered near 3.93%, reinforcing a backdrop where five straight weeks of equity losses coexist with only modest relief from duration.
Real yields are competing directly with traditional hedges. Ten-year TIPS yields remained above 2%, helping to explain why gold and Bitcoin have struggled to break higher despite war headlines – investors are being paid to own safety again.
Japan’s bond market is no longer a sideshow. Thirty-year JGB yields climbed toward 3.7%, extending a multi-quarter repricing that signals the end of “free yen duration” and raises the risk of capital being repatriated from overseas carry trades at the margin.
The dollar reclaimed the top of the defensive league table. The DXY pushed back above 100 to roughly 100.15 as higher US yields and classic safe-haven demand outweighed growth worries, adding another headwind for non-US risk assets and commodities priced in dollars.
What’s pertinent this week (Week 13)?
Hormuz: from scare to structural energy tax
Coverage: Dominant | Quality: Institutional-grade, real-time | Market Impact: Extreme*
The Iran war remained the central narrative. Oil futures and newswires alike treated the Strait of Hormuz as functionally constrained, with reports confirming that while some tankers were getting through under heavy escort and higher insurance premia, overall flows remained far below normal.
President Trump’s earlier 48-hour ultimatum to “obliterate” Iranian power plants if Hormuz was not reopened has morphed into a rolling April 6 deadline, with the White House talking up “productive” back-channel discussions even as Tehran publicly denies any such talks. Markets are trading that ambiguity as a regime, not a placeholder: the energy complex is now priced for a world in which a meaningful share of Gulf export capacity is at risk for weeks or months, not days.
The transmission into broader assets is straightforward but brutal: higher oil feeds into higher breakevens and stickier headline inflation, which in turn pins nominal yields higher and compresses equity valuations, especially for long-duration segments. Energy equities and resource-heavy indices like the TSX remain among the few clear winners, while energy-importing economies in Europe and Asia quietly absorb a second, unwelcome tax on household and corporate cash flows.
Powell’s “new inflation” and a five-week equity bleed
Coverage: Very high | Quality: Official transcript plus broad sell-side consensus | Market Impact: High in rates, significant in equities*
The Fed didn’t meet this week, but its March message kept echoing. Having raised its 2026 inflation projection and explicitly flagged the “uncertain” implications of the Iran conflict for growth and prices, the FOMC has now effectively shifted from “patiently waiting to cut” to “waiting to see whether war-driven inflation proves sticky.”
Markets seem, finally, to believe them. Fed funds futures now embed only a shallow easing path, and the 2s–10s curve has steepened by a few basis points, not because growth looks fantastic, but because the market has given up on an early, aggressive cutting cycle in the face of an oil and dollar shock. The result is an uncomfortable combination: five consecutive weekly declines in the S&P 500, the worst run since the Iran war began, alongside bond yields that refuse to reward duration shorts with a proper spike.
In that environment, leadership is quietly rotating. Balance-sheet quality, cash-flow visibility and pricing power matter more than factor labels, and energy, financials and parts of value-tilted consumer names are finding support even as the high-multiple growth complex is forced to re-price its discount rates. The Fed is no longer the market’s shock absorber; it is one of the shock sources.
Japan’s long end and the death of “free yen”
Coverage: Moderate but focused | Quality: High, policy-detailed | Market Impact: Medium now, rising over time*
The final narrative sits slightly off the front pages but matters for anyone thinking about global funding and the carry trade. Japan’s 30-year government bond yield climbed to roughly 3.7% this week, a move that would have been unthinkable a few years ago and that now cements the end of the BoJ’s de facto yield-curve-control era.
Governor Ueda’s earlier insistence on a cautious exit remains in place, but the combination of imported energy inflation, wage gains and a weaker yen has forced markets to test how far long-end yields can rise before domestic buyers balk. For global investors, the implication is simple and profound: at north of 3.5%, unhedged JGBs compete directly with Treasuries and Bunds, especially once FX hedging costs are taken into account, threatening to unwind a generation’s worth of yen-funded carry structures.
So far, the spillovers are subtle – marginal steepening in global curves, a stickier term premium in the US, and periodic wobbles in risk assets when JGB yields lurch higher in thin liquidity. But in a world where the Fed has told you cuts will be slow and where war has re-introduced a true energy shock, the re-pricing of Japanese duration is another reason to think the cost of capital globally is shifting up a notch, not re-visiting the 2010s.
Looking ahead to Week 14
Three lenses still feel most useful as we move from Palm Sunday into the heart of spring.
First, duration of disruption. Every extra week of constrained Hormuz flows hardens the narrative that we are dealing with a structural energy tax, not a transient spike; watch shipping data, insurance premia and any verifiable mine-clearing or convoy arrangements more closely than headlines about “talks.”
Second, policy patience versus political pressure. Powell has been clear about “new” inflation risks, and the Fed’s projections have moved accordingly; any sign that rising gasoline prices, market volatility or election-season rhetoric start to erode that patience will matter more than the next decimal place on a core PCE print.
Third, leadership and liquidity. Equities are quietly rotating toward cash flows that can live with higher input costs and higher real rates, while gold and crypto are being reminded that hedges compete with assets that actually pay you a yield. In fixed income, both Treasuries and JGBs are telling the same story: the price of safety is rising, not falling.
Ed’s closing bell: Palm fronds and pressure points
From the gardens on the Rock, Palm Sunday feels like it always does: families drifting back from church, flags snapping idly in the Levanter, ships queueing up in the Bay with the patient choreography of a normal port.
But in portfolio space, Palm Sunday 2026 lands in the middle of something less placid. A war-linked energy tax is now embedded in oil; the Federal Reserve has stopped volunteering to underwrite every wobble in risk assets; and Japan – the great provider of free duration for a generation – is starting to demand a real coupon.
The lesson, from one strait to another, is as old as shipping itself: chokepoints are not just geographic. They are also conceptual – places where too many optimistic assumptions have been funnelled into too narrow a narrative. Hormuz is one such chokepoint today. So, increasingly, is the belief that central banks can glide us back to cheap energy, cheap money and effortless growth on a timetable of our choosing.
As ever, these reflections are my own, not those of Quay Financials (Gibraltar) Limited, and they are no substitute for your own homework or a proper conversation with someone who knows your circumstances. Palm leaves are a reminder of welcome and of fragility. Treat your risk budgets with the same mix of reverence and realism.
Reading list for Week 13
On the war and oil
- Crude Oil – Price – Chart – Historical Data – News (Trading Economics) – WTI at 99.64, Brent at 112.57, with a breakdown of the month-long move.
- Xinhua / China.org: “Crude futures settle higher” – confirmation of the March 27 WTI and Brent settlements.
- PFL Petroleum Markets Report – March 27, 2026: concise roundup of war-linked supply fears and the weekly performance of Brent and WTI.
On the Fed, inflation and markets
- FOMC March 18, 2026 statement and Summary of Economic Projections on federalreserve.gov – the primary source for the new inflation and rate path.
- AP / Yahoo / WTOP: “How major US stock indexes fared Friday 3/27/2026” – clean summary of the week’s moves in the Dow, S&P 500, Nasdaq and Russell 2000.
- Trading Economics / YCharts data for US 2-year and 10-year Treasury yields – useful for charting the slow creep higher in term premia.
On Japan and JGBs
- Investing.com: “Japan 30-Year Bond Yield Historical Data” – day-by-day record, including the jump to roughly 3.71% on March 27.
- Trading Economics: “Japan 30 Year Bond Yield” – overview of the move and its context.
- BOJ and specialist summaries of the March Monetary Policy Meeting, with Ueda’s remarks on imported inflation and wage dynamics.
On gold, Bitcoin and the dollar
- USA Today / CBS: “Gold price today: March 27, 2026” – spot price context after the early-year peak.
- PriceGold.net: “Gold price on Friday, March 27, 2026” – detailed close at 4,493.79 per ounce and intraday range.
- YCharts / TwelveData Bitcoin historical price series – Coinbase close of 66.35K on March 27.
- Trading Economics: “United States Dollar – DXY” – DXY back above 100 with a breakdown of the recent move.
- When war turns an energy route into a toll road and central banks stop offering shortcuts, remember this: you cannot pray away a higher cost of capital, but you can choose not to be levered to denial.
Full Disclaimer
The views expressed in this blog are my own personal market observations and reflections. They do not constitute investment advice, a financial promotion, or a recommendation to buy or sell any security. This publication is not made in my capacity as a director of Quay Financials (Gibraltar) Limited, which is authorised and regulated by the Gibraltar Financial Services Commission. You should always conduct your own research and seek independent advice appropriate to your circumstances before making any investment decision.
Information has been obtained from sources believed to be reliable, but no representation or warranty is given as to its accuracy, completeness or timeliness. Market levels and weekly changes are compiled from the Week 13 market table supplied for this edition and public market data available for the close on 27 March 2026, and may vary by venue, instrument and closing convention. The value of investments and the income derived from them may fall as well as rise, and investors may not recover the amount originally invested. Past performance is not a reliable indicator of future results. Readers should conduct their own research and obtain independent professional advice appropriate to their circumstances before making an investment decision.
